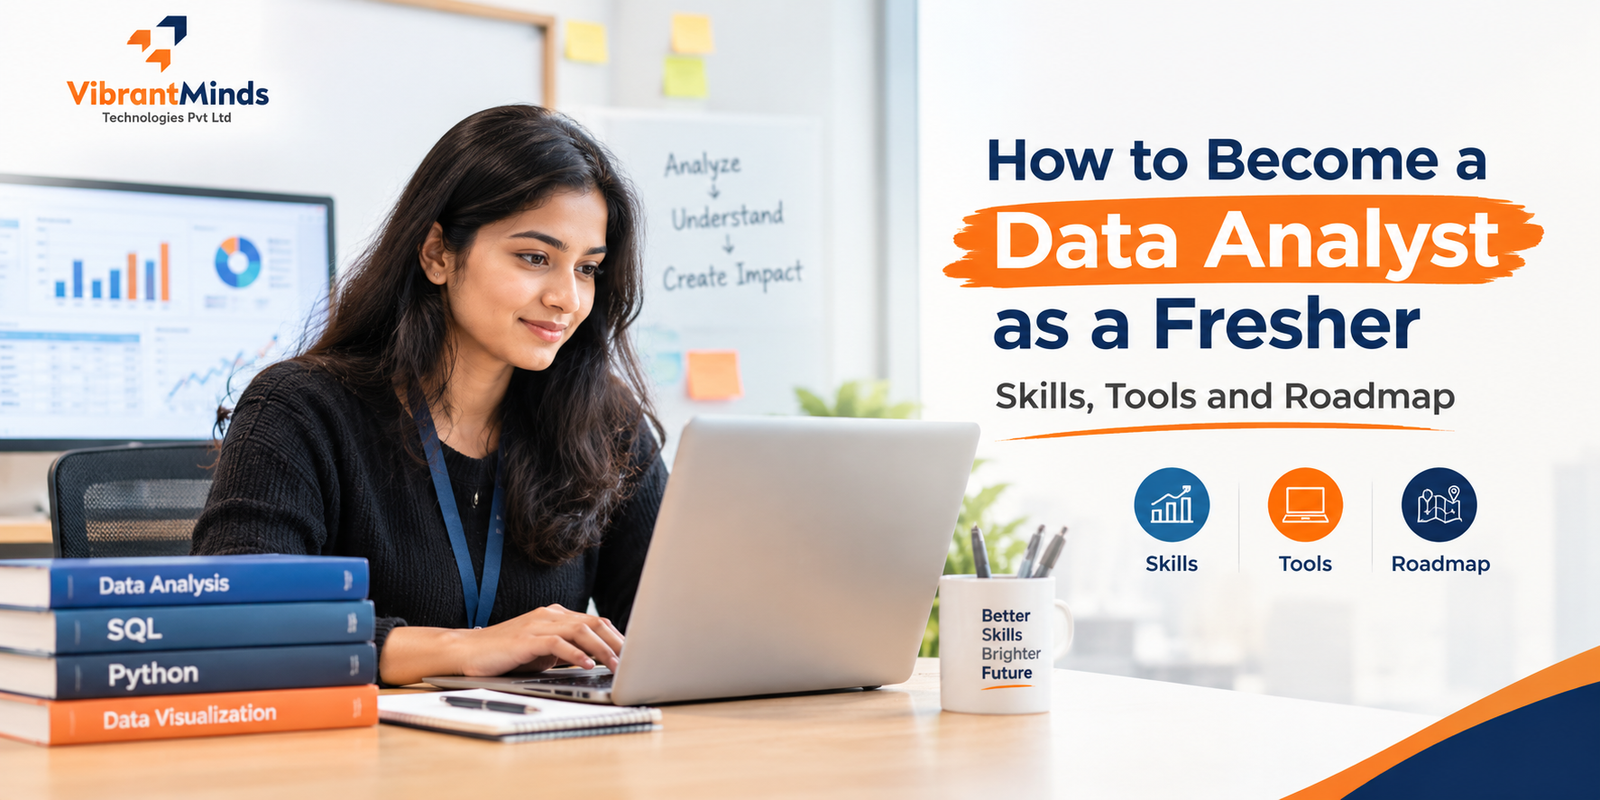
If you like numbers, patterns and answering questions with evidence, a data analyst role can be a strong first step into IT. This guide explains how to become a data analyst as a fresher: what the job involves, how it differs from data science and data engineering, the skills and tools you need, and an eight-step roadmap with working examples in Excel, SQL and Python. It is written for graduates from IT and non-IT backgrounds who have no experience yet.
You will also find project ideas, interview topics to prepare, common mistakes and honest guidance on what affects fresher pay, without made-up numbers. Timelines and outcomes vary from person to person, so treat this as a practical learning path, not a promise.
|
Explore VibrantMinds VibrantMinds Technologies is a Pune-based IT training and recruitment company. Learn more about its courses and placement process, or visit the candidate portal. |
What Does a Data Analyst Do?
A data analyst turns raw data into answers that help a business decide what to do next. Instead of guessing why sales dropped or which customers leave, an analyst collects the relevant data, cleans it, analyses it and presents the findings in a form that non-technical people can use.

In a typical week, a fresher analyst might:
• Pull data from a database using SQL queries.
• Clean spreadsheets and fix missing values, duplicates and formatting problems.
• Build summary tables and charts in Excel or Python.
• Create or update dashboards in a tool such as Power BI or Tableau.
• Write short reports that explain what the numbers mean and what to do about them.
Notice how much of the job is cleaning and explaining, not just calculating. That is why communication matters as much as tools.
Data Analyst vs Data Scientist vs Data Engineer
These three roles are often confused. They overlap, but their main focus differs:

• Data analyst: answers business questions using data, builds reports and dashboards. Common starting point for freshers.
• Data scientist: builds statistical and machine learning models to predict or classify. Usually needs stronger maths and programming.
• Data engineer: builds and maintains the pipelines and storage that deliver data to analysts and scientists.
SQL and Python appear in all three, which is why they are the best investments. Job titles vary by company, so always read the job description. A role called "Business Analyst" or "MIS Analyst" may involve similar skills with a stronger business focus.
Is Data Analytics a Good Career for Freshers?
For people who enjoy analysis, it can be. Almost every organisation collects data, so analyst skills apply across industries such as retail, banking, healthcare and technology. The path can also lead to specialised roles in data science, data engineering or business analysis.
It is also a field that rewards proof over claims. Employers want to see that you can clean messy data, write correct queries and explain a conclusion, so projects matter more than certificates. Learning several tools at once can feel heavy, and entry-level openings can be competitive, so plan for steady practice.
Data Analyst Salary for Freshers: What Affects It?
Fresher salaries vary widely by company, city and role, so quoting one number would mislead you. Check current job listings for the exact role and location you want. Offers generally depend on your SQL and Excel strength, your Python and visualisation skills, the quality of your projects, how clearly you explain your work in interviews, and the type of company.
Skills Needed to Become a Data Analyst
Technical Skills
• Excel: formulas, lookups, pivot tables and charts.
• SQL: SELECT, joins, GROUP BY, subqueries and basic window functions.
• Statistics basics: mean, median, mode, standard deviation, correlation and sampling.
• Python: Pandas for data handling, NumPy for numbers and Matplotlib for charts.
• Data visualisation: a BI tool such as Power BI or Tableau, plus chart design principles.
Soft Skills
• Curiosity: asking why a number changed, not just reporting it.
• Communication: explaining findings in plain language to non-technical people.
• Attention to detail: spotting wrong data before it spoils the analysis.
• Business understanding: knowing what the numbers mean for the organisation.
Data Analyst Roadmap for Freshers: 8 Steps
Follow the steps in order, and build something small at each one.
Step 1: Understand the Role and Pick a Domain
Read ten fresher data analyst job descriptions and note the tools they repeat. Also pick a domain you find interesting, such as retail, finance, sports or education, because analysing data you care about makes projects more engaging and more convincing.
Step 2: Learn Excel Properly
Excel is still where many analyses start. Master cleaning, formulas, lookups, conditional logic and pivot tables. These formulas appear in interviews and daily work:
EXCEL FORMULAS
=SUMIFS(C:C, A:A, "Pune") -> total of column C where A is Pune
=COUNTIF(B:B, ">100") -> count values above 100
=AVERAGEIFS(C:C, A:A, "Pune") -> average for one city
=XLOOKUP(E2, A:A, C:C) -> look up a value (newer Excel)
=IF(C2>=150, "High", "Normal") -> simple label
You are ready when: you can take a messy sheet, clean it and build a pivot table with a chart without help.
Step 3: Learn SQL
SQL is the most requested analyst skill because most business data lives in databases. Learn SELECT, WHERE, ORDER BY, GROUP BY, HAVING, joins and subqueries first.
SQL
SELECT city, SUM(sales) AS total_sales
FROM sales_data
GROUP BY city
ORDER BY total_sales DESC;
You are ready when: you can answer questions like "which city sold the most?" and "which customers ordered more than twice?" with queries you write yourself.
Step 4: Learn Statistics Basics
You do not need advanced maths to start, but you do need the basics: averages (mean, median, mode), spread (range, standard deviation), distributions, correlation and the idea of sampling. Learn when a median is better than a mean, such as when a few very large values distort the average, and remember that correlation does not prove one thing causes another.
Step 5: Learn Python and Pandas
Pandas lets you load, clean, filter, group and summarise data in a few lines. Start with reading CSV files, handling missing values, grouping and basic charts.
PYTHON (PANDAS)
import pandas as pd
df = pd.DataFrame({
"city": ["Pune", "Pune", "Mumbai", "Mumbai", "Pune"],
"month": ["Jan", "Feb", "Jan", "Feb", "Mar"],
"sales": [120, 150, None, 180, 160]
})
# Fill the missing value with the average of the known sales (152.5)
df["sales"] = df["sales"].fillna(df["sales"].mean())
print(df.groupby("city")["sales"].sum())
# city
# Mumbai 332.5
# Pune 430.0
# Name: sales, dtype: float64
You are ready when: you can load a CSV file, clean it, group it and produce a chart using only code.
Step 6: Learn a Visualisation Tool
Power BI and Tableau are two widely used business intelligence tools. Learn one well: connect to data, build charts, add filters and assemble a clear dashboard. Good dashboards follow a few principles: show the most important number first, use the right chart for the question, keep colours consistent and remove clutter.

The dashboard above uses fictional data to show the idea: key numbers at the top, then a comparison, a trend and a share chart.
Step 7: Build Three to Five Projects
Projects are your experience. Choose public datasets or create your own, and for each project show the question, the cleaning steps, the analysis and what you recommend. Publish code and dashboards on GitHub or a portfolio page, with a short README in plain language. Good project ideas:
• Sales analysis: find top products, regions and monthly trends, and recommend where to focus.
• Customer behaviour: segment customers and identify who is most likely to return.
• HR analytics: explore attrition patterns using a public or sample employee dataset.
• Public data: analyse a public dataset on a topic you care about, such as cricket, education or transport.
For every project, end with a business recommendation, not just charts. That habit is what separates analysts from chart makers.
Step 8: Prepare Your Resume and Interviews
Keep your resume to one page, lead with skills and projects, link your portfolio and list only tools you can explain. Practise explaining each project in three parts: the question, what you found and what you would recommend. Rehearse SQL queries on a real database and be ready to describe how you clean data.
Data Cleaning: The Skill Employers Test Most
Real data is rarely tidy. Analysts often spend more time cleaning data than analysing it, so interviewers like to ask how you would handle messy input. A reliable cleaning routine covers these checks:
• Duplicates: the same record entered twice inflates totals.
• Missing values: decide whether to remove, fill or flag them, and explain why.
• Wrong data types: dates stored as text and numbers stored as strings break calculations.
• Inconsistent text: "pune", "Pune " and "PUNE" should be one value.
• Outliers: extreme values may be errors or may be genuinely important, so investigate before removing.
PYTHON (PANDAS CLEANING)
df = df.drop_duplicates() # remove repeated rows
df["city"] = df["city"].str.strip().str.title() # fix spaces, case
df["order_date"] = pd.to_datetime(df["order_date"]) # fix data type
df = df.dropna(subset=["customer_id"]) # drop rows missing a key
print(df.isna().sum()) # missing per column
When you describe a project, always mention the cleaning steps you took and why. It shows the interviewer that you have handled real data, not just textbook examples.
Excel, SQL or Python: Which Should You Use When?
Good analysts pick the tool that fits the task. Excel is best for small datasets, quick calculations, pivot tables and sharing results with non-technical colleagues. SQL is best when the data lives in a database, because it filters and aggregates large tables quickly where the data is stored. Python is best for larger or messier datasets, repeatable cleaning, automation and more advanced analysis. A common workflow pulls data with SQL, cleans and analyses it with Python, then presents it in a BI tool or Excel.
A 90-Day Learning Plan for Freshers
This is an indicative plan for someone studying about two hours a day. Your pace may be faster or slower, so adjust the blocks to fit your schedule.
1. Days 1 to 15: Excel basics, formulas, pivot tables and charts. Clean one messy sheet.
2. Days 16 to 35: SQL fundamentals, joins and aggregations. Practise daily on a real database.
3. Days 36 to 50: statistics basics, then your first small analysis with real data.
4. Days 51 to 70: Python and Pandas: loading, cleaning, grouping and plotting.
5. Days 71 to 82: Power BI or Tableau: build one dashboard from your analysis.
6. Days 83 to 90: polish three projects, publish them, update your resume and practise interview answers aloud.
Data Analyst Interview Questions Freshers Should Prepare
• What is the difference between WHERE and HAVING in SQL? WHERE filters rows before grouping; HAVING filters groups after.
• What is the difference between INNER JOIN and LEFT JOIN? INNER returns only matching rows; LEFT keeps every row from the left table.
• How do you handle missing values? Check why they are missing, then remove, fill with a sensible value such as the mean or median, or flag them, depending on the situation.
• Mean vs median: when would you use each? Median is better when extreme values distort the average.
• What is a pivot table? A tool that summarises data by grouping and aggregating it without writing formulas.
• What makes a good dashboard? Clear purpose, key numbers first, appropriate charts, consistent colours and minimal clutter.
• Walk me through one of your projects. Explain the question, data, cleaning, findings and recommendation.
Also expect general HR questions, so prepare your introduction and project stories.
Common Mistakes Freshers Make When Starting in Data Analytics
1. Collecting tools instead of skills. Depth in Excel, SQL and one BI tool beats shallow knowledge of ten.
2. Doing only tutorial projects. Use different data and answer your own questions.
3. Skipping data cleaning. Real data is messy, and employers know it.
4. Showing charts without conclusions. Every analysis should end with what to do.
5. Ignoring communication. An insight nobody understands has no value.
6. Listing skills on the resume that you cannot demonstrate.
About VibrantMinds Technologies
VibrantMinds Technologies Pvt. Ltd. is a Pune-based IT training and recruitment company. It operates as a talent ecosystem that connects candidates, colleges and companies, with 1900+ partner colleges and 600+ hiring companies in its network.
Visit vibrantminds.in to learn about the company, or open the candidate portal at candidates.vibrantminds.in.
These are the VibrantMinds courses:
|
Course |
Duration |
Key topics |
|
Full Stack Java Development |
4–6 months |
Core Java, OOP, SQL and JDBC, web fundamentals, backend frameworks, front-end basics, projects |
|
Software Testing (Manual + Automation) |
2–5 months |
Testing fundamentals, test cases, bug reporting, SDLC and STLC, automation basics, interview preparation |
|
Core Java |
1–2 months |
Syntax, OOP, strings, collections, exception handling, practice programs |
|
Python & Data Science |
2–4 months |
Python basics, data handling, analysis libraries, visualisation, introduction to machine learning |
How VibrantMinds Helps You Start a Data Analyst Career
The Python & Data Science course (2–4 months) maps to the middle of this roadmap. Its topics include Python basics, data handling, analysis libraries, visualisation and an introduction to machine learning, which cover Steps 5 and 6 and give you material for Step 7 projects. The roadmap also uses Excel, SQL and a BI tool, so ask the team which of those are covered in the current batch and how hands-on the project work is.
The VibrantMinds 6-step placement pipeline then connects your preparation to real openings:
1. Requirement Mapping: understanding what hiring companies need, so your learning matches real requirements.
2. Candidate Sourcing: identifying candidates who fit those openings.
3. Screening & Assessment: checking skills and readiness, so gaps surface before a real interview.
4. Drive Coordination: organising recruitment drives with hiring companies.
5. Interview Support: preparing candidates for interview rounds.
6. Onboarding Follow-up: staying in touch after selection to support the joining process.
|
VibrantMinds tip Not sure whether Python & Data Science, Full Stack Java or Software Testing suits you best? Talk to the team, and ask which projects, assessments and interview practice are part of the batch. |
Real Outcomes: What Past Students Say
Feedback shared by past students mentions placements with companies such as Aress Software and Education Technologies, Saama Technologies and Three M Software. To be clear and fair: outcomes vary from person to person, depending on skills, effort, attendance, interview performance and company requirements. Nothing here is a guarantee of a job, so please confirm details directly with the VibrantMinds team before you decide.
Connect With VibrantMinds Technologies
Address: Viva Academy Building, Warje, Pune, Maharashtra 411052
Phone: +91 95035 79517
Email: support@vibrantmindstech.com
Website: https://vibrantminds.in/
Candidate portal: https://candidates.vibrantminds.in/
Join the Job-Update WhatsApp Groups
Group 1: https://chat.whatsapp.com/CUCS1derlmTFee2c9dyUHd
Group 2: https://chat.whatsapp.com/FvMf1fGYQYnHppQ8AwFX40
Group 3: https://chat.whatsapp.com/I7RNnGMkb2L8S8HibdyWpQ
|
Caution: never pay anyone to apply for a job or to get shortlisted. If someone asks for money in exchange for a job opportunity, stop and verify directly with the company or the VibrantMinds team. |
Frequently Asked Questions About Becoming a Data Analyst
Can a non-IT graduate become a data analyst?
Yes, many analysts come from commerce, science and other streams. Build Excel, SQL and Python skills, create projects and show them. Eligibility rules differ by company, and no outcome is guaranteed.
How long does it take to become a data analyst?
It depends on your starting point and how much you practise. Structured programmes such as the Python & Data Science course run 2–4 months, and self-study timelines vary widely from person to person.
Do I need a degree in statistics or mathematics?
Not necessarily. Many entry-level roles accept graduates from varied streams, but you need basic statistics and strong logic. Check each job description for its criteria.
Do I need to learn Python, or is Excel and SQL enough?
Excel and SQL cover many entry-level tasks, and many job descriptions also list Python and a BI tool. Learning Python widens your options and helps with larger or messier data.
Power BI or Tableau: which should I learn first?
Both are widely used. Read job descriptions in your target city and learn the one that appears more often. The core dashboard skills transfer between them.
Is data analyst the same as business analyst?
No, but they overlap. Business analysts focus more on requirements, processes and stakeholders, while data analysts focus more on querying, analysing and visualising data. Read the job description.
Where can I find datasets for practice projects?
Use public datasets from government portals, research repositories and open data platforms, or create your own data from a topic you follow. Always check the dataset's licence and terms of use.
Will AI replace data analysts?
Tools, including AI-assisted ones, are changing how analysis is done, and nobody can predict the exact impact. Analysts who understand the business question, check data quality and explain results clearly are best placed to adapt.
Final Thoughts: Start With One Question and One Dataset
You do not need to master every tool before you begin. Pick a question you are curious about, find a dataset, clean it, analyse it and explain what you found. Repeat that cycle with Excel, then SQL, then Python, then a dashboard, and your portfolio builds itself. Employers hire analysts who can turn messy data into a clear recommendation.
If you would like structured training in Python and data skills, or help deciding which course suits your goals, the VibrantMinds team is happy to talk it through.